New gaps and cracks appear over time, but how much is too much?
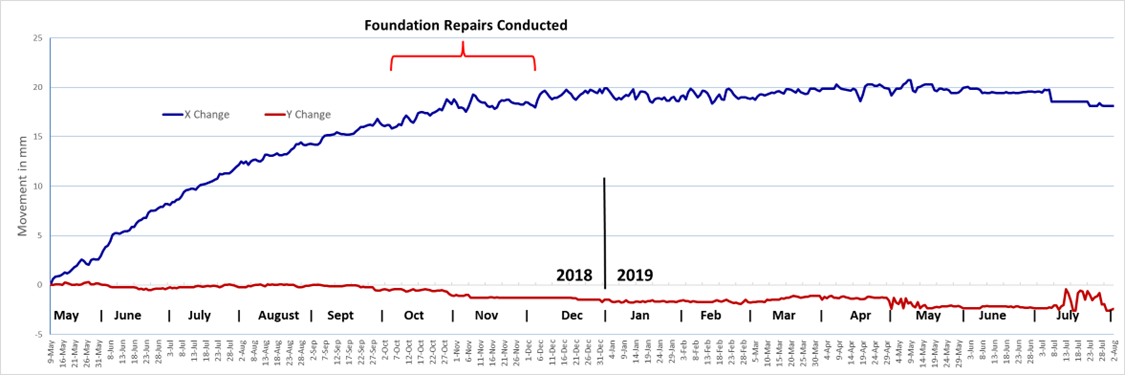
Movement Over Time
There are typically three components to building movement; thermal, geotechnical, and structural.
Each of these occurs on a different time scale; years, months, weeks, or even hours. Simple analog gauges with ad hoc manual measurement times often mask short term movement that has longer term consequences.
As an example, a measurement taken in the heat of a Texas afternoon in April might compare similarly to a measurement taken in the early morning 3 months later in July. However, comparing full day movement cycles could reveal a noticeable change in the crack not only throughout the day but also across the 3 months.
Only by measuring frequently and consistently over time can these individual effects be put into proper context.
Expert Studies Show
Structural Health Data Systems
Continuous high-fidelity data ensures better understanding of building effects and provides ongoing peace of mind for building owners
The TOP 12 Advantages of Automated Monitoring
The advantages of automated electronic crack monitoring over traditional static analog gauges are numerous and, in the end, economically superior. This paper covers the benefits of electronic devices.
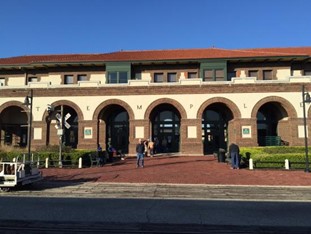
Historical Structures benefit from long-term monitoring
We appreciate old things of significance, historic relics and memories that spark reflection of where we originated, events that shaped our culture, and how those before us lived and persevered. Preservation of these records against degradation is important and valued.
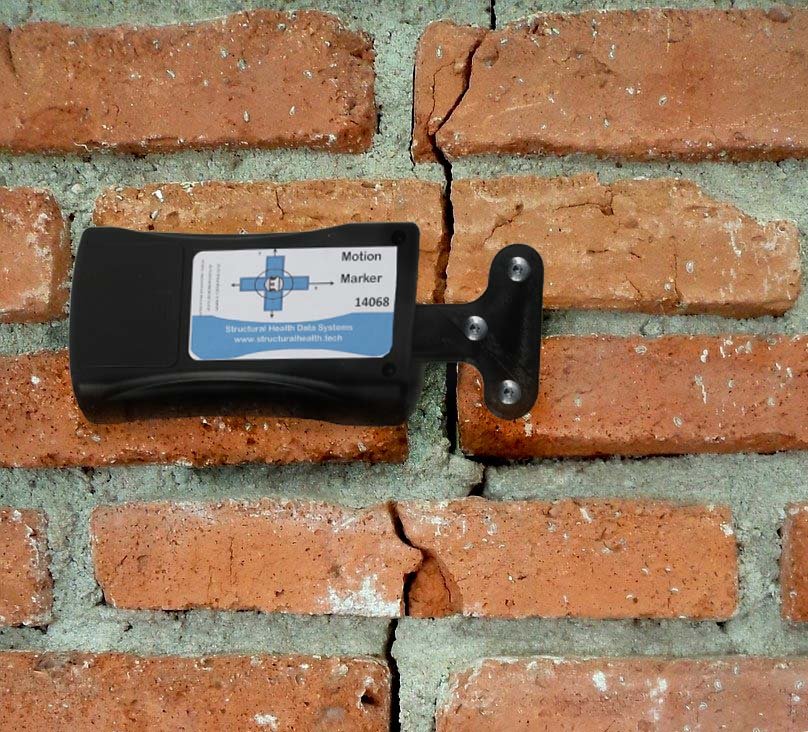
There are several noteworthy advantages of using an electronic automated crack monitor over traditional static gauges (metal or plastic). See our article on the advantages of an electronic crack monitor for a complete list.
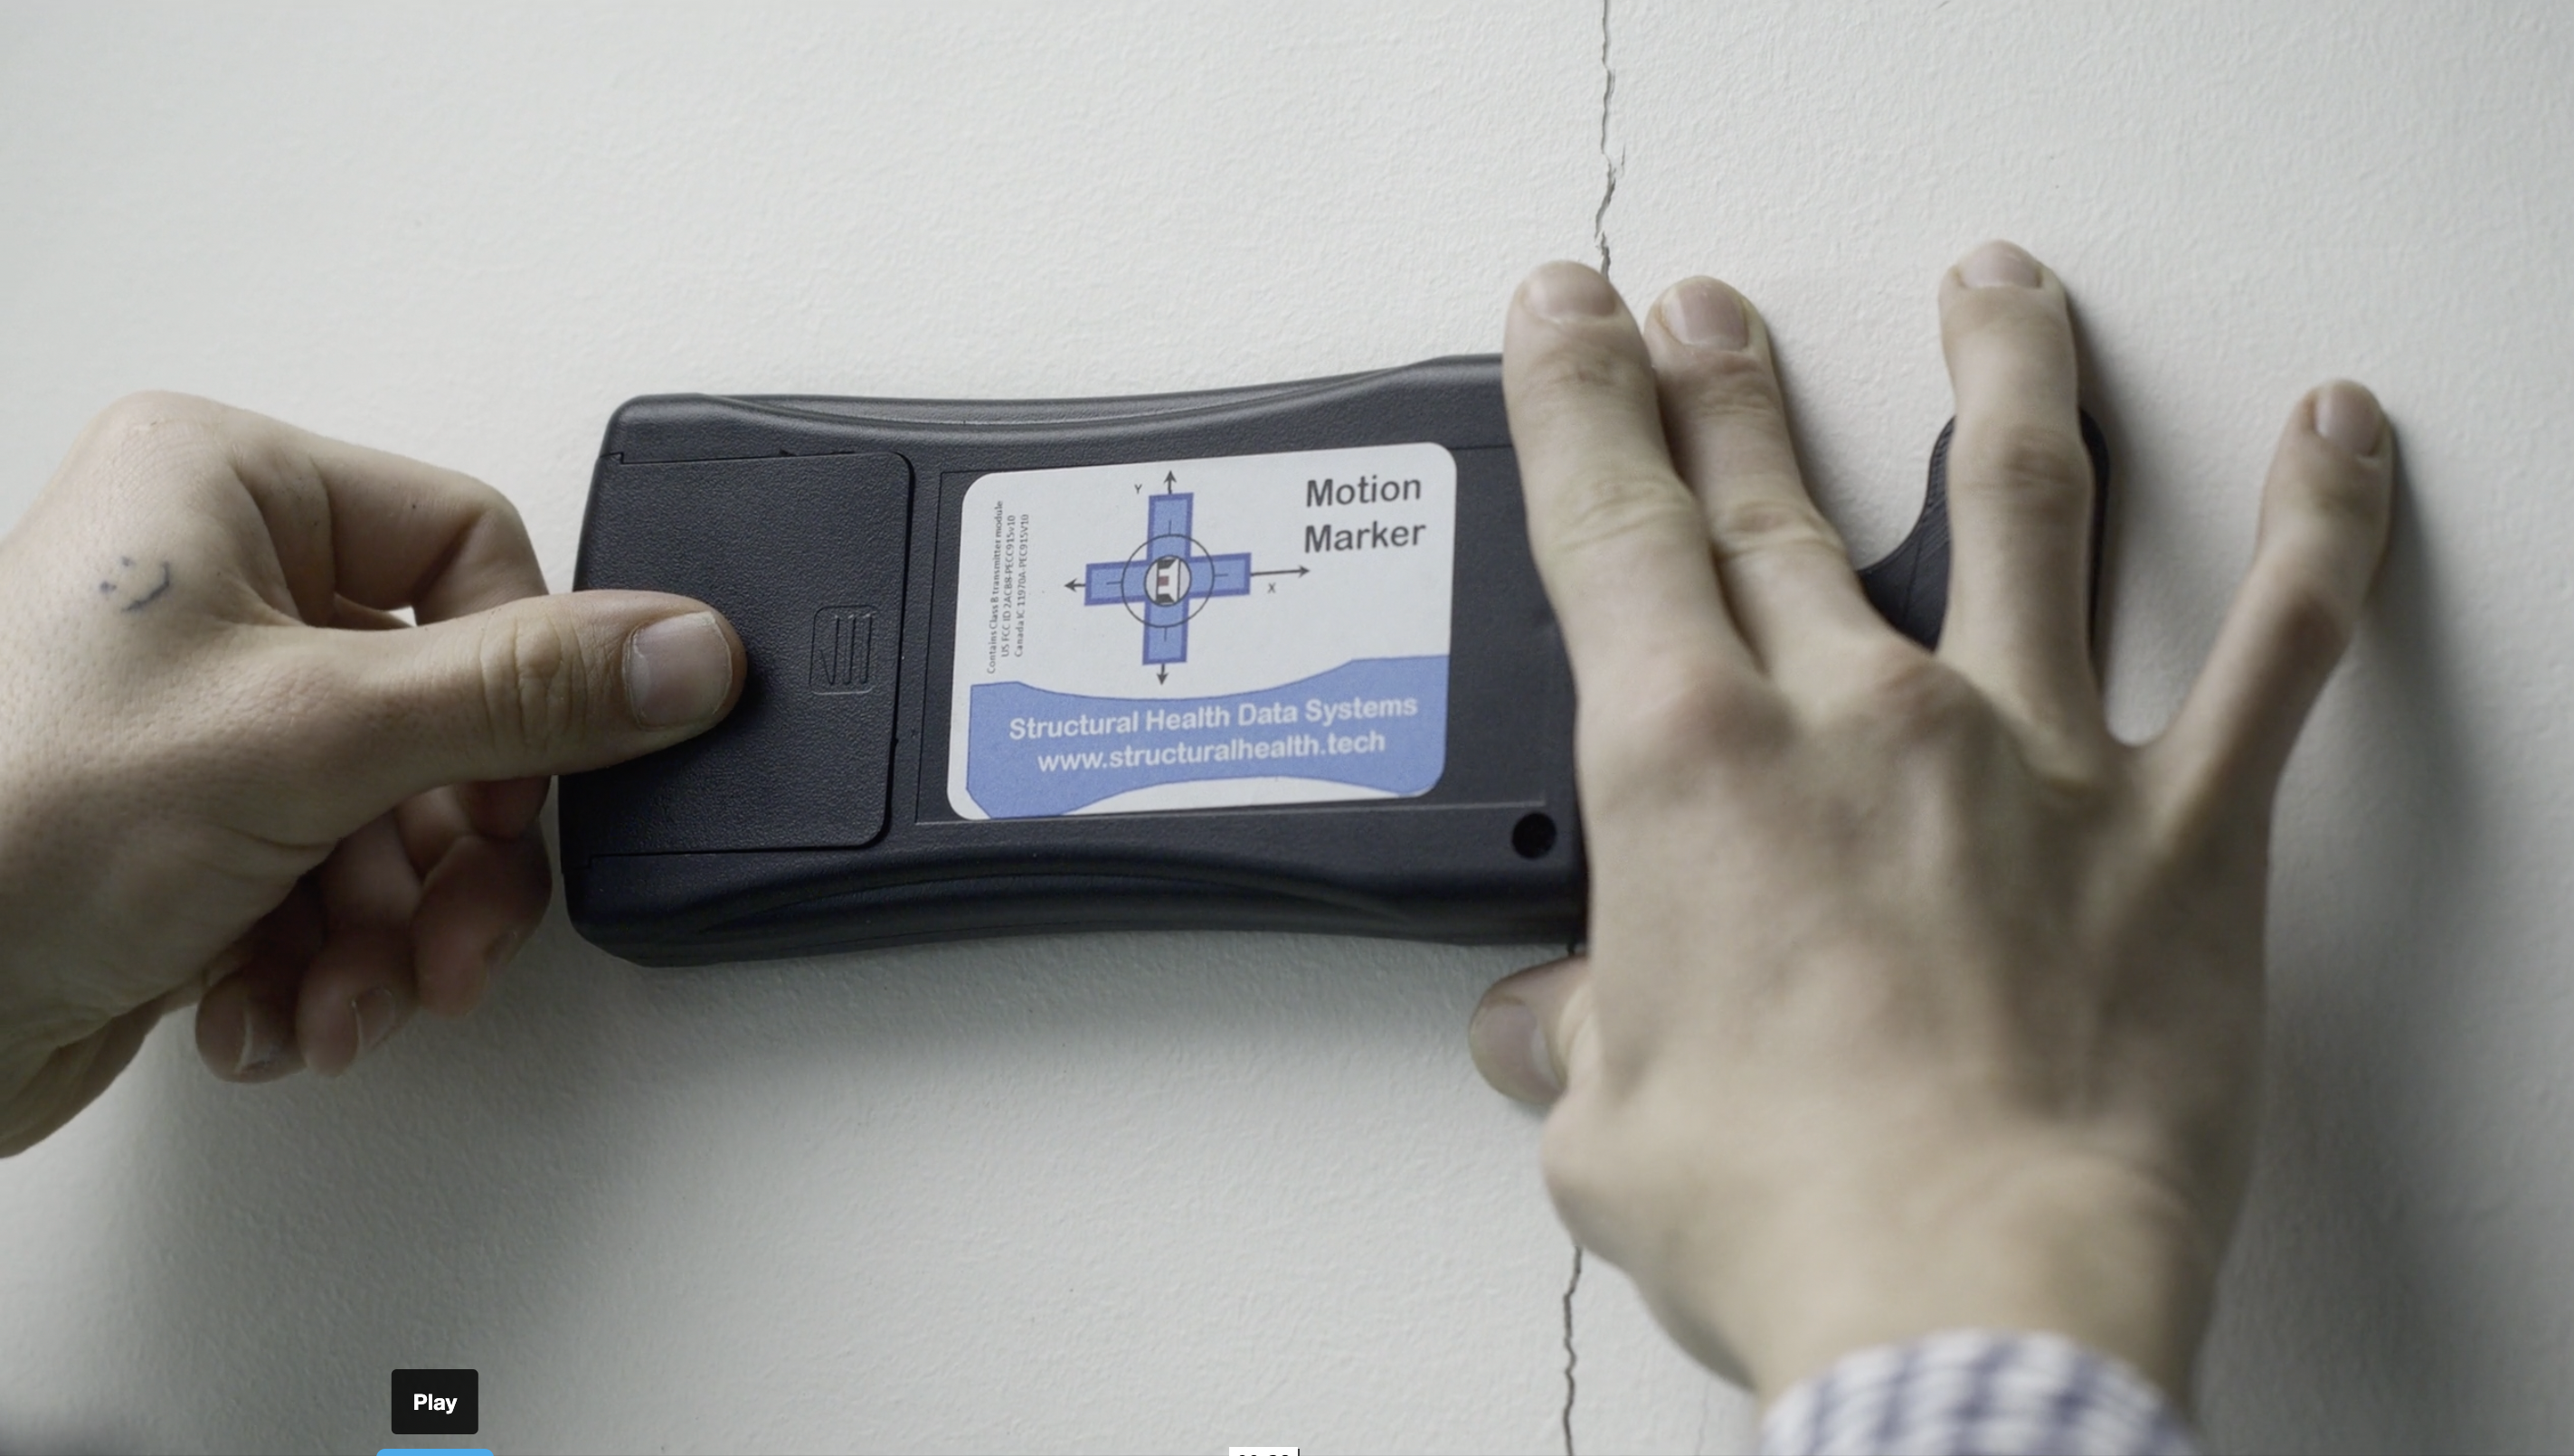
The device shown is battery-operated and designed for multi-year operation. The device wakes hourly, measures the growth or shrinkage of a crack in both X and Y directions with 0.2 mm accuracy, reads the ambient temperature, time stamps the record, and transmits the data to a web-based application for capture, analysis, reporting, and real time notification as required.
For reference, 0.2 mm is about the thickness of 2 sheets of common copy paper.